What is the best way for integrators to address seasonality?
This is Part 3 of our blog series from Joel Harris, Understanding Variable Costs is Wildly Important for Your Integration Business.
In the first two installments, Harris shared his experience of using a variable cost structure to transform an acquisition from losses into profit, plus examples of how he has applied this principle in many different situations over the last 20 years.
In this installment, Harris offers a detailed example of how integrators can address seasonality and increase profits by using labor as a variable cost.
The most common application of generating incremental profitability from your base of current business in a systems integration company is addressing normal seasonality. The concept noted below in this specific scenario can be applied to many other situations where using variable costs will incrementally improve profitability.
Although revenue can be highly variable from month to month, a simple way to determine if you have seasonality in your business is to take the monthly average of revenue for the past 3 – 5 years (exclude any year that has a known significant abnormality in it, such as 2020). Then, plot a histogram of the average monthly revenue and seasonality will become obvious. I find smoothing to the quarter is sufficient.
For our example, let’s take a company that has this simplified cost structure on an annual basis:
- 80% COGS made up of 50% direct labor and 50% equipment, i.e. 20% gross margin (GM)
- 15% SG&A made up of 70% indirect labor, i.e. 5% net profit before tax (PBT)
Let’s also profile seasonality as 22% of revenue is earned in Q1, 26% in Q2, 28% in Q3 and 24% in Q4.
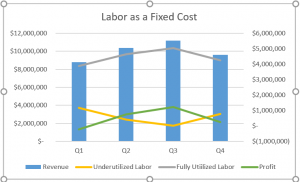
Your revenue, labor expense (fully utilized and under-utilized) and profit would be shown in this chart.

This is not a wild fluctuation in total revenue. Yet, if your cost structure is optimized to deliver the maximum revenue (Q3), then you are underutilizing your labor by 21% in Q1, 7% in Q2, and 14% in Q4. If you could forgo the underutilized labor in both direct and indirect costs, you would earn 24.3% GM on the same revenue with a 10.9% PBT.
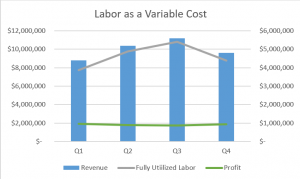
If you staffed to the lowest quarter of revenue (Q1) and paid a 30% premium on labor above that staffing level for all labor needed above that baseline for the other three quarters, your GM would be 23.0% with a 9.1% PBT result on exactly the same revenue that you previously earned a 5% PBT. See example in this chart.

Or put another way, you can increase your PBT by 182% simply by building your business with truly variable labor costs. In dollars, if you are running a $40 million revenue company, you can increase your PBT from $2,000,000 to $3,640,000 by exchanging fixed labor costs for variable costs (or conversely grow sales to $73 million to achieve this profit amount at a 5% return).
Which is the easier path to higher profits?
Stay tuned for the final installment in our series, So, All I Have to Do Is Hire Subcontractors and Temps to Be Profitable?
Listen to the Navigator Podcast
Navigator Podcast: Understanding Variable Costs with Joel Harris
Keep Reading: Part 1 – Profits Hiding in Plain Sight
https://navigatemc.com/understanding-variable-costs/
Keep Reading: Part 2 – A Variable Cost Structure Adds Profitability to Your Integration Business
A Variable Cost Structure Adds Profitability to Your Integration Business
 Do you want to learn more?
Join Navigate Academy!
Don’t miss our next live webinar
Friday, July 24 @ 11:00 am CDT
Understanding and Shaping Company Culture


